[davidev] EMA/MA with projection# EMA/MA with projection
## What it is
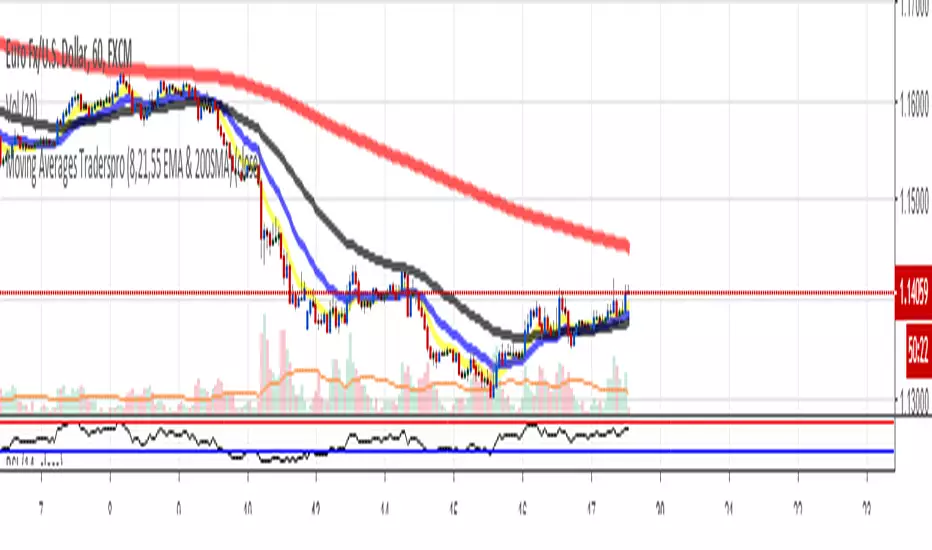
A lightweight overlay that plots up to three EMAs and one MA (default: 5/21/55 EMAs and 200 MA) and draws a forward projection from the current bar. The projection extrapolates the latest per-bar change (slope) to visualize where each average *could* be in the next N bars—useful for planning entries, dynamic support/resistance, and anticipating crossovers.
Note: The projection is a simple linear extrapolation of the most recent change. It is not a prediction or signal.
## How it works
Computes EMA1, EMA2, EMA3 and MA (SMA) on your chosen sources.
On the last bar only, it draws a short line segment ahead by `Bars Ahead`, using the most recent change (`ta.change()`) × number of bars to project the line.
Lines are **reused** and updated each tick (no clutter), and deleted on historical bars to avoid artifacts.
## Good for
Visualizing **dynamic levels** slightly ahead of price.
Quickly gauging **momentum** and **slope** of your moving averages.
Sketching possible **crossover timing** (e.g., 5 vs 21 EMA) without changing timeframe.
Cleaner charting: projection only renders on the last bar, so historical candles stay uncluttered.
## Tips
Combine with your market structure/volume tools; the projection helps **plan**, not predict.
Shorter EMAs react faster and will show more pronounced projected moves; longer MAs remain steadier.
Increase `Bars Ahead` on higher timeframes; keep it small on scalping charts to avoid overreach.
אינדיקטור Pine Script®